
Air particle sampler long-range data acquisition and control software design extracts require particle data collection in many industrial areas to obtain field data, and then analysis based on field data collected to determine the state of the site. This design uses single tablet STM32 as a core microcontroler to control the frequency of collection and to process particle concentration data, which will be measured at the site...
Remote data acquisition and control software design for air particle samplers
Summary
In many industrial areas, particulate data collection is required to obtain field data and then to analyse and determine the state of the site based on data collected in the field. This design uses single-piece STM32 as a core microcontroler to control the frequency of collection and to process particle concentration data, which will be shown at the site of measurements, data distribution and distribution using the generic cluster wireless service technology GPRS, remote monitoring, and the display and storage of cashing line maps on data processing methods. The system addresses the collection and control of remote data, increasing the automation of the entire system and facilitating the use of the monitoring centre.
Keywords: General Group Wireless Communication Technology (GRPS); single-piece machines; data transmission, monitoring
Design of air particulate sampler of remote data acquisition and control software
ABSTRACT
As the increasingly serious air pollution, much more attention need to be paid into the concentration of air particulate matter. Particle data collection must be carried out in many industrial fields in order to obtain the field data. Then we could make the corresponding measures according to the results. This design uses the STM32 microprocessor as the core micro controller to process the data, then transfer it to the test center by GPRS module, so it can show in the terminal by the discount graph.
Key words: GPRS(General Packet Radio Service); MCU(Micro Control Unit); data transmission; monitoring
Table of Contents
Introduction 1
- Background of the study 1
- 2 Design elements 2
2 System programme design 3
- General remarks 3
- 2. Composition of the system 3
- 2.1 Module on data acquisition 3
- 2.2 Data transfer module 4
- 2.3 Data processing at testing centres 5
3 Hardware design for air particulate samplers 6
- 1 PM2.5 Cutter 6
- 1.1 Design indicators 6
- 1.2 The working principles of the cutter 6
- 1.3 Design elements of the cutter 6
- 1.4 Structure design of the cutter 7
- 1.5 Choice of collector material 9
- 2 GPRS module interface design with STM32 10
- 2.1 Overview of the GPRS module 10
- 2.2 External interface circuits and single-piece connections 11
4 Air particulate sampler software design 13
- 1. General design 13
- 2 Main program design 13
- 3 SIM90A module TCP data transfer design 14
- 3.1 GPRS and GSM model selection 14
- 3.2 Choice of modalities for the GPRS network 14
- 3.3 The rationale for TCP data transmission 16
- 3.4 GPRS/Particle Sampler Terminal Communication Protocol 6
- Monitoring centres 22
- 1. The design of the software ..............................................................................................................................................................................................................................................................................................................................................................................................................................................................................................................................................................................................................................................................................................................................................................................................................................................................................................................................................................................................................................................................................................................................................................................................................................................................................................................................................................................................................................................................................................................................................................
- 1.1 Use of WinSocket controls in TCP applications 23
- 1.2 Building connectivity 23
- 1.3 Data transmission 23
- 2 Database design 23
- 3 Interface design 24
6 Conclusion 25
Acknowledgement 27
References 28
Appendix 29
Appendix A. Site of the graduate design enterprise 29
Appendix B. Information note on CD-ROM 30
Annex. CGRS/Particle Sampler Terminal Communication Protocol Reference 31
1 Introduction
- 1Research background
As industry advances and develops, pollution hazards, whether air, water, or solid pollutants, have become increasingly harmful to our productive lives. Particle matter is the subject of air pollutants, mainly because of its porosity and adsorption, so it becomes a carrier of pollutants and exists in a gaseous aerosol. The smaller the particulate matter, the more stable it is in air, the slower it is to sink, the more likely it is to be sucked into the respiratory tract. The monitoring of air particles is therefore of particular importance, as it is necessary to warn and take measures when the concentration of particles exceeds a certain threshold. Our environmental monitoring level has improved considerably with the strengthening of environmental protection efforts, and equipment such as soot samplers, flue gas samplers, and total suspended particles samplers are very close to international levels.
Our environmental monitoring system, which is developed mostly by small and medium-sized enterprises (SMEs) and largely by low- and medium-sized equipment, cannot be satisfied with the rapid development of environmental monitoring. In real-time monitoring, the number of samples collected, mainly in small and medium-sized traffic, is clearly inadequate for the physical analysis of fine particles.
The first generation collects data collectively based on specialized computers and specialized operating systems.
The second generation is based on the General Computer-based Remote Data Acquisition System, with the widespread use of computers and other universal workstations, and the operating system is generally a common UNIX operating system. The first generation and second generation of data acquisition systems have common features based on centralized computer systems and the system does not have an open system.
The third generation of remote data acquisition systems, based on distributed computers and associated database technologies, which are the fastest-growing phase of our remote data acquisition system, brings together the latest computer technologies into the data acquisition system. Mobile communications technology has now evolved to the age of 4G, with transmission rates of up to 100 M/bps; In fact, given the size of the transmission data that has already been transferred, the question of the utility of the module and the cost of communication, a very mature GPRS communication technology has been selected at this stage.
The basic conditions for a fourth generation of remote data acquisition systems are in place. The main features of the system are the continued expansion of the integration of data acquisition systems with other systems, the integration of safe economic operations and the commercialization of operational requirements, using such technologies as mobile communications technology, Internet technology, target-oriented technology and neural network technology.
- 2 Design content
The main component of the design of the remote data acquisition and control software for air particle samplers is to address the problem of remote data acquisition and control. The sampler is an air particle sampler developed by the Shanghai Instrumentary Research Institute of its own hands-on unit, using the cutter to obtain aerosol particles in air in fixed flow, to obtain particles that meet the requirements of the study using the sampler ' s filtering, filtering and online re-acquisition of particulate data, and to conduct processing analysis using a single machine, STM32, to obtain the required particle concentration Data. The single SPM32 also controls the transfer of data from the GPS module to the monitoring centre, thus addressing the problem of units that were previously unable to monitor data collection remotely, and furthering the intelligence of instruments for the use of information gathering, data processing, signal control, etc. in air particle detection systems.
The project will eventually require the establishment of a long-range air particle monitoring system, which will increase the automation of the entire system and will also facilitate the use of the monitoring centre, further reflecting systematization and networking in information exchange, remote monitoring, etc.; and an initial online model for real-time air particle monitoring, which will better serve the field of air environment monitoring and analysis.
2 System solution design
- 1 Overview
Particle concentration monitoring is used in many locations, and there are many alternative particle sensors available on the market, most of which are photodissemination tests, microscopy tests or inertial methods tests. Because these tests are more demanding to measure the environment, particulate matter monitoring is usually in a worse outdoor environment and requires real-time monitoring, which cannot be satisfied with the test requirements. According to aerodynamics, air enters the nozzle, with a smaller area, a higher flow speed and a high rate of air flow ejecting from the nozzle; rough particles in the air stream are more inertial and impact is blocked on the shield; and small particles, because of their inertia, are unable to reach the shield, flow down, and are captured by filters. The key technology is to establish a mechanical structure, with the diameter of the shield and the length of the pipe to accommodate the aerodynamic fine particles and to ensure that the air enters the sampler at a certain speed.
The collection of particle concentration data, which is processed through STM32 single-piece machines, is followed by the delivery of the GPRS module, which is sent through the GPRS network and then receives and folds data using terminal equipment such as computers, which allows for real-time data transmission and is safe and effective. GSM is one of the more mature, well-developed and widely applied mobile communication systems currently based on time-based multi-site technology, and the GPRS is a continuation of GSM, while the increased speed of data transmission makes the GPRS advantage even more obvious. Compared to the 3G network and even the now widely used 4G network, its transmission rate may be low, with the 4G network reaching even 100 Mbps. However, the rapid and inexpensive nature of GPRS provides new tools for industrial remote surveillance, which has low investment, low cost and high reliability, and high value for money in cases where real-time requirements for operations and monitoring are low. This is a good match for data transmission from this experiment. With the declining price and cost of the GPRS communication module, the GPRS is becoming a two-way solution for cheap and efficient wireless data transmission, wireless remote detection.
- 2 System composition
- 2.1 Data acquisition module
The data-collection module installed at the measurement point consists mainly of two components, the PM2.5 cutter and the single machine, developed by the Shanghai Instrumentometer Institute, which first obtains air particles through a mid-flow ventilator, then uses unique structural designs and reasonable traffic control, filters air particles and collects particles suitable for the particle, and finally uses online weighing and single machine processing to obtain data, using a led display screen on site to alert the scene when the limit is exceeded. The instrument ' s appearance is shown in figure 2-1.
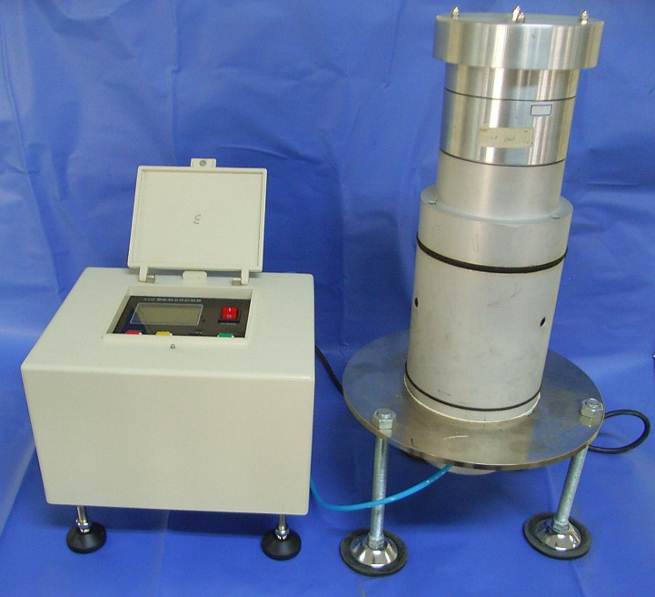
Figure 2-1 Instrument appearance picture
- 2.2 Data transmission module
The data transfer module, which uses SIM9000A as a communications chip, is a double-frequency GSM/GRPS module that uses SMT fully to enable the transmission of data and information at low capacity. It is also embedded in the TCP/IP protocol, which supports TCP/UDP communications and FTP/HTTP services. In order to ensure the stability of data transmission, the TCP mode of communication is used to establish a connection at the time of communication, followed by data transmission. At the same time, the GPS/Air Particle Sampler Terminal Communication Protocol was established in accordance with the requirements of the system, the corresponding protocol transmission was installed during the communication and the system ' s specifications were improved, and the data transfer module map is shown in figure 2-1.
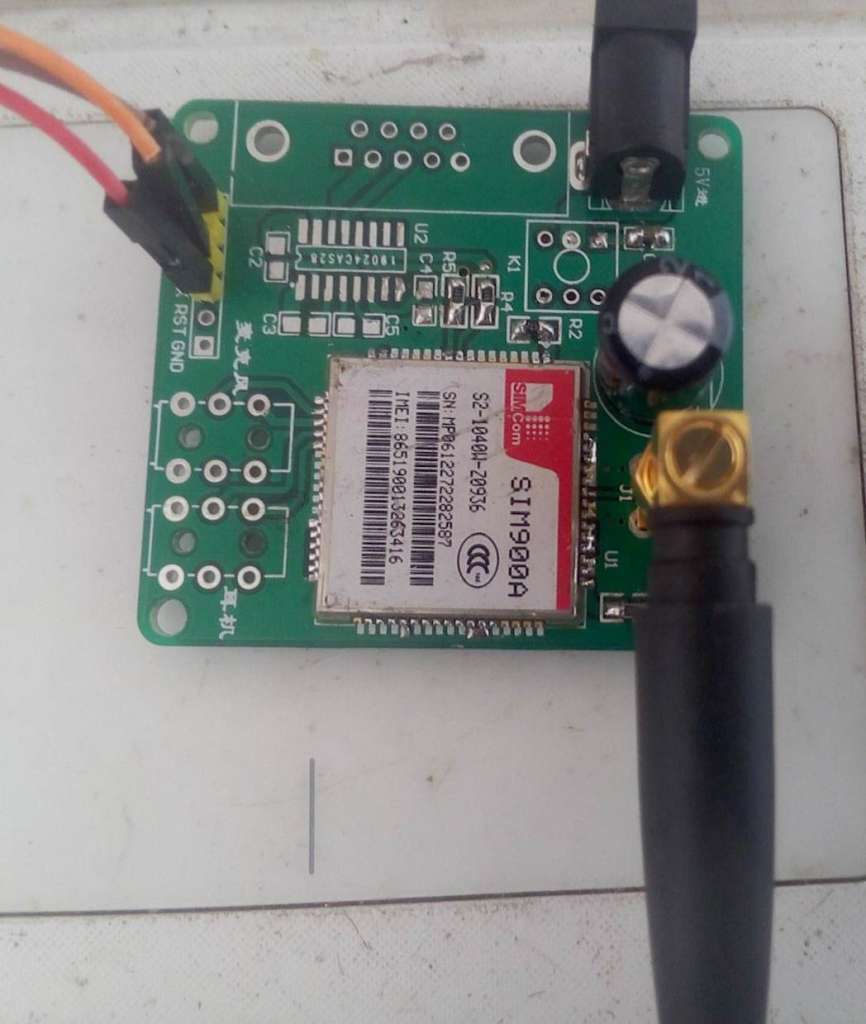
Figure 2-1 Physical diagram of data transmission module
- 2.3 Monitoring center data processing
The monitoring centre receives data on the concentration of air particles sent by the air particle sampler terminal for a determination, stored in the established database if the communication protocol is met, then automatically determines whether or not the alarm value is exceeded while processing the data, as shown in the circuit chart, and, if this is exceeded, alerts the alarm.
- Hardware design of air particle sampler
- 1 PM2.5 Cutter
- 1.1 Design indicators
The main indicators for its design, as required by the project plan terms of reference, are as follows:
(1 sample flow: Q = 100 ~ 120 L/min;
(2 cutting particles: dp50 = 2.5 ± 0.5 μm;
(3
Original site pictures are temporarily unavailable:
Geometric standard deviation of capture efficiency:
(4 Control accuracy of sample flow: ± 8%.
Of these, dp84.1, dp15.9 are particle diameters corresponding to collection efficiency of 84.1% and 15.9%, respectively.
- 1.2 Cutter Working Principle
The impact cutter consists mainly of impact plates and collector panels. As shown in the figure, when passing through the shock panel, the wind flow is increased by a sudden reduction in the cross section of the route, so that the particles and the gas flow out of the hole at the same high speed, but the bottom is a collection panel vertically in the direction of the air flow, which changes the direction of the aerosol particles, which by their inertia is greater than the air flow itself, lags behind the air flow, and the larger the particle matter, the greater the momentum, the greater the lag; At the same current speed, particles are hit on a collector board when the movement of particles exceeds a certain threshold, but cannot be completely transformed in direction. particles less than the threshold are taken by the air flow around the collector board and captured by the next filter; the air flow map is as shown in 3-1.
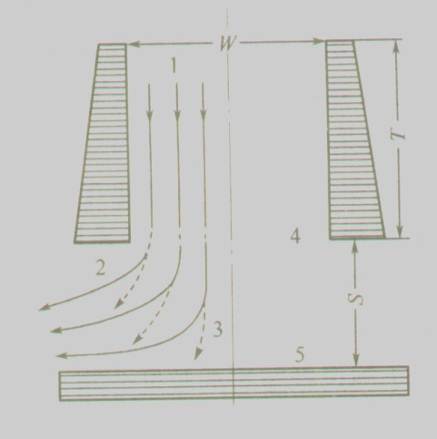
Figure 3-1 Air flow diagram
- 1.3 Key points of cutter design
According to the aerodynamic kinetic pattern of particles, four parameters are designed to focus on research. First, the width of the hole is W, which is the main guarantee for cutting the particle size, the smaller the width, the faster the vent flow, the smaller the particle's kinetic amount, the smaller the particle's particle size that can bypass the collector's shield. But the smaller the hole, the less efficient the sampler and the more difficult the process is. Second, the gap between the hole and the collector's plate is S, which is another important parameter for determining the cutting. The smaller the gap, the smaller the particle particle size, which can bypass the collection block. Once again, the depth of the hole is T, and a reasonable depth will ensure the direction of the particle and increase the efficiency of its collection.
After these three conditions have met the requirement to cut the particle size, the total cut-off area of the impact plate will determine the range of values to be taken from the flow of air that is allowed to pass. Also due to the working principles of the inertial cutter, the cutter design had to consider three issues: the collection of particle rebounds on the surface, over-sedimentation of the collector board (which would lead to the recovery of particles), and poor grade performance (e.g. due to the loss of particles between stages).
The typical method of mitigating particle rebounds is the coating of viscous substances, such as grease or crude oil, on impact plates, which, in order to remain in these coatings, are usually pore-shaped. Currently, there is widespread use of: perforated metal plates, perforated fibre sheet film, polytetrafluoroethylene filters. Using any of the collecting plates, there is more or less an excessive deposition problem. Collector panels (gatherers) often follow the capture of a layer of particles, and the particles coming in will impact on the particles and rebound. The impact plates will therefore be large enough to ensure higher capture efficiency for longer sampling periods, especially in high loads.
- 1.4 Structural design of cutter
Based on the analysis of the above points, the following data have been preliminarily identified as the basic parameters of the cutter, as shown in table 3.1. This has led to the design of the impact plates as shown in table 3-1 and the collection boards as shown in figure 3-2, which were processed into samples of the cutter as shown in figure 3-3.
Table 3-1 Design parameters for the PM2.5 cutter
Nozzle width W (mm)
Nozzle length L (mm)
Throat length T (mm)
Collision distance (mm)
S1=1.25W
S1=1.8W
S2=2.1W
- 962
- 2
5
- 2
- 75
- 95
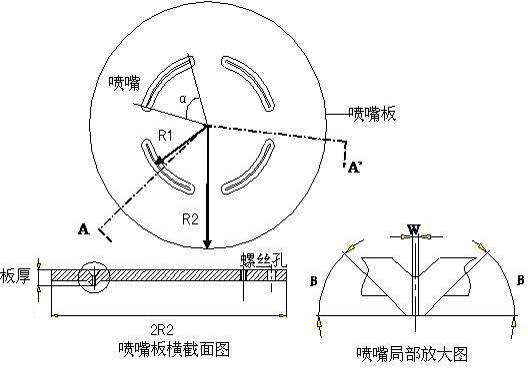
Nozzle plane layout for the PM2.5 cutter, Figure 3-2
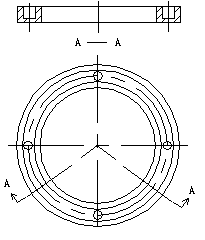
Figure 3-3. Structure of the PM2.5 cutter collection board
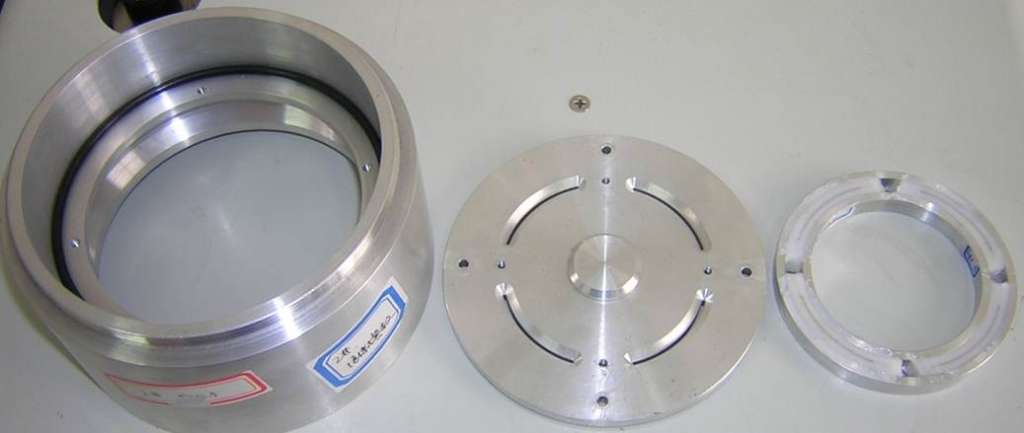
Figure 3-4 PM2.5 cutter
The completion of the sample is merely a theoretical calculation, and whether we can meet our equipment needs will also need to be calibrated. In this process, the cutting properties of the cutter are evaluated primarily in different cases. The impact distance from S and the impact material from the collecting plate (hard aluminium plate, PUF material) are evaluated in the absence of other parameters. In the process of calibration, the length of the copper column between the nozzle and the collecting plate is used to adjust the collision distance from S (e.g., figure 3-4); The impact of different collision materials is evaluated by replacing the collector panels (e.g., figures 3-5).
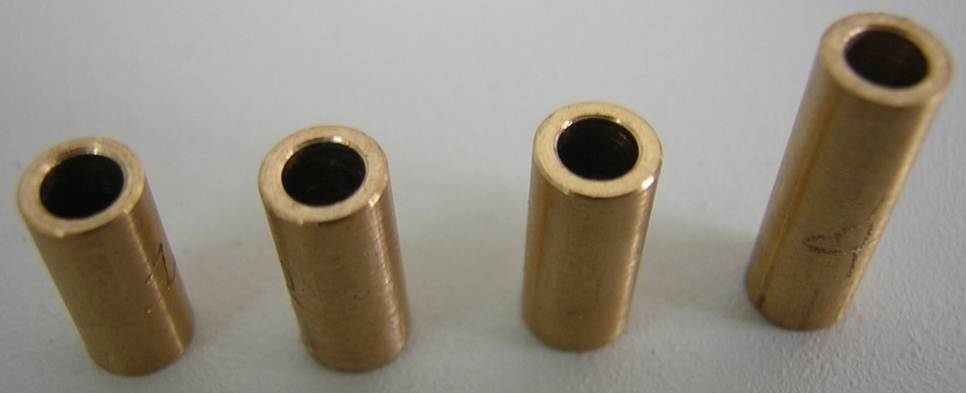
Figure 3-5 Copper poles used to regulate collisions at distance from S
- 1.5 Collection board material selection
In addition to the structure, the choice of materials is crucial, especially for the pick-up boards, where different materials will directly play a critical role in the efficiency of the cutter's collection. The main disadvantages of the adoption of hard-weight collectors are the limited amount of dust, the presence of serious particle rebounds and the rebreathing of the pick-up boards. In order to mitigate the rebound and re-breathing, the pick-up boards usually use coatings of mineral oil or viscous substances, such as lipids, which have been shown to be the preferred coatings. However, the collection capacity of such boards is still limited, and the efficiency of samplers depends on the amount of dust collected on the boards. The application of porous PUF (polyurethane foam) materials can provide a greater amount of dust, based on the performance of cutting. The nature of the PUF is stable, the chemical background values are low and the collection efficiency is high.
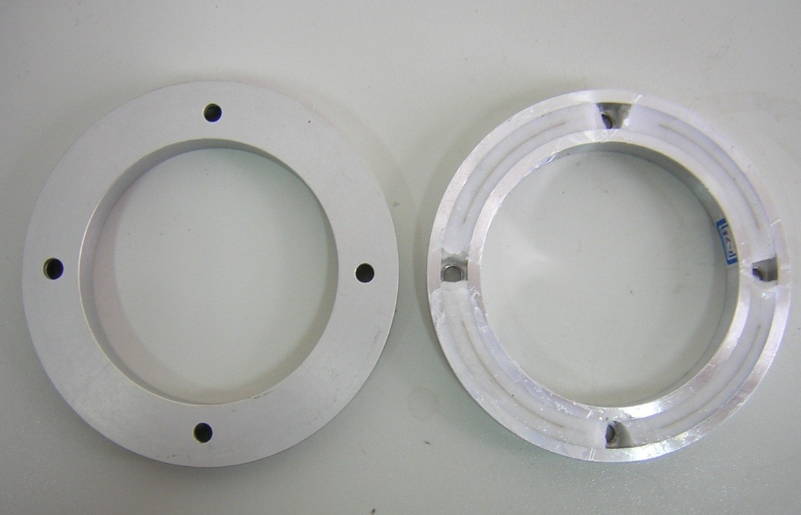
Figure 3-6 Hard aluminium plates and collector panels for PUF-filled materials
- 2 GPRS module interface design with STM32
- 2.1 Introduction to GPRS module
The GPRS module used in this design consists of a company-designed ATK-SIM90A, which uses SIMCOM ' s industrial-grade GSM/GRRS module: SIM90A, working-band double frequency: 900/1800 MHz, which allows for the transmission of voice, SMS, data and fax information at low capacity.
- 2.2 Peripheral interface circuit and microcontroller connection
The SIM90A module itself has two modes of communication: GSM/GRPS, which need to be connected to STM32 using a serial external device, so that the connection between the single-piece machine and the communication module can be completed. The SIM slot is set aside for external access to the circuit itself, and the SIM card selection is best handled by mobile communication cards. The rationale for the GPRS module is shown in figures 3-7:
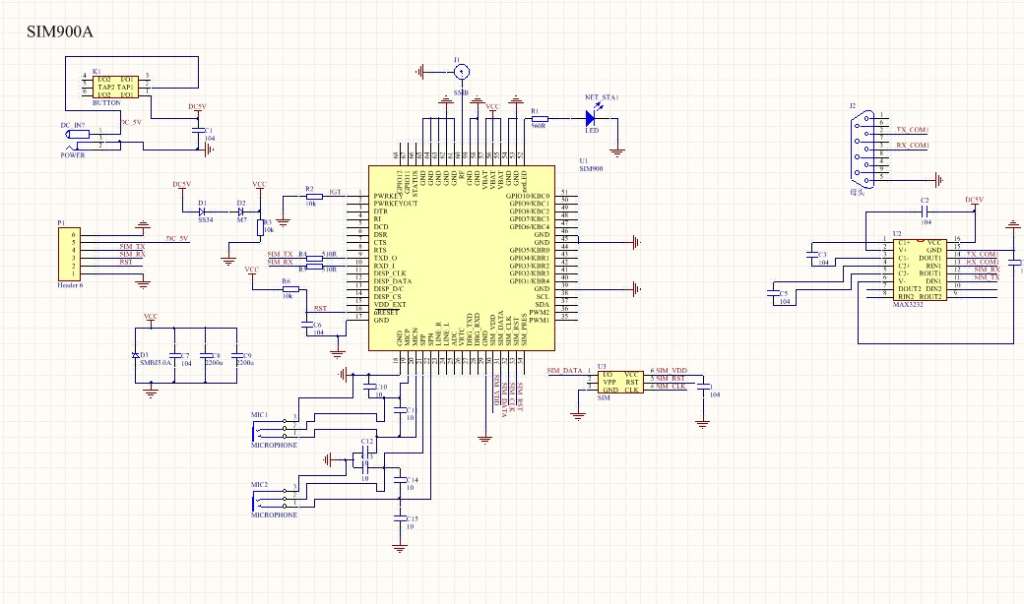
Figure 3-7 GPRS module wiring principles
The main among them is the conversion of MAX32322 electro-levels, the effect of which is to convert the TTL level out of a single machine into 232 electro-levels accepted by PC or the TTL level out of a PC to a single-format, standard RS-232-C, which stipulates that the drive allows a capacity load of 2,500 pF and that the communication distance will be subject to this capacity limit, e.g. the maximum communication distance is 15 m when a communication cable of 150 pF/m is used; The distance of communication can be increased if the electrical capacity of the cable is reduced per metre. Another reason for the short transmission distance is that RS-232 is a single-end transmission of signals, which has problems with co-moderal noise and failure to inhibit co-mode interference, and is therefore generally used for RS232(9) interface communications within 20m.
What is required for the design of the STM32 circuit is to process the weight data measured by the air cutter and to process the concentration data, followed by STM32 and GPRS communications, STM32 reserved the USB 232 interface, and SIM90A reserved the serials, which are linked through the USB transhipment link. Meanwhile, the CAN module has been added, and the CAN bus network has facilitated the receipt and transmission of data information at one node, and can also collect sensor information for other measurement modules in real time. STM32 circuits are used, as shown in figures 3-8, and STM32 circuit PCB diagrams are shown in figures 3-9.
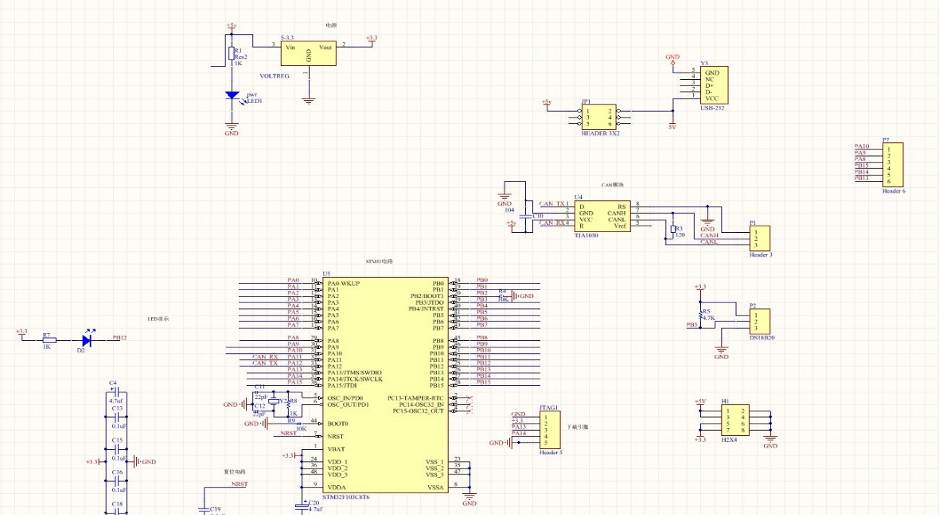
Figure 3-8 STM32 module schematic diagram
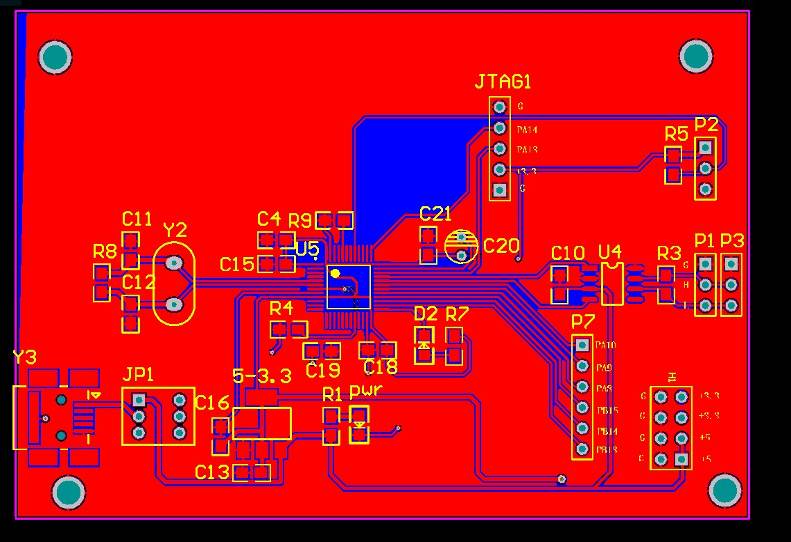
Figure 3-9 PCB for STM32 module
4 Air particle sampler software design
- 1 Overall design
Software design is essential for the correct acquisition of particle concentrations, and only if the software design is reasonable will the system work in an orderly manner. The software design for particle concentrations is based on hardware connections and can also be divided into two parts, one for the collection and processing of particle concentrations; and the other for the transmission of data.
The poor readability and maintenance of the compilation language, and the low portability of the code without a good comment, can create some obstacles to the project. The C language can well address this problem, allowing the entire air particle detection site to operate under control, and the software for the system, Keil μVision4, has been developed with good programming practices, which have led to a significant improvement in the readability and portability of the system. It is designed in a manner corresponding to hardware design, using modular design ideas, and is divided into the corresponding program modules, which are designed and debugged separately, thus enhancing the portability of the program.
- 2 Main program design
It is primarily a link to the various modules, which are performed by calling the various modules. First, the program begins with the initialization of the single-formula machine and the GPRS module, filtering the required PM2.5 after the air cutter has acquired the particles in the air; On-line weighing, obtain data on air particulate matter concentrations based on the corresponding function, determine whether the processed particulate matter concentration data is exceeded or, in the case of an on-site alert, then send the LED display screen and, if not, send the data directly to the monitoring centre through the GPRS module, and use the receiving sub-procedure to determine whether the data has been successfully sent or, if it has been successfully sent, wait for the next data to be sent or, if it has not, re-transmit the data once, twice, so as to avoid the procedure falling into a dead cycle.
The program flow chart is shown in Figure 4-1
。
Original site pictures are temporarily unavailable:
Figure 4-1 Program flow chart
- 3 SIM90A module TCP data transfer design
- 3.1 GPRS and GSM mode selection
There are two main modes of SIM900A module communication: GSM SMS and GPRS (General Group Wireless Operations), the reason for choosing the GPRS mode of communication is the following:
(1) Real-time online two-way data transmission
GSM is a circuit exchange system, while GPRS is a group exchange system. The GSM communications principle is that users send a short message first to the monitoring centre ' s server and then the monitoring centre queues all incoming text messages and sends them sequentially to the corresponding recipient. It consumes some unnecessary time, not to mention the time taken to re-transmit SMS late when the user is shut down or when it is beyond normal communication in the service area, and the possibility that late and re-transmitted SMS after normal text messages may result in a later SMS first-time situation, which is likely to lead to unpredictable errors in industrial controls.
GPRS group exchange technologies are “high-speed” and “permanent online” features relative to GSM. Real-time online features allow users to remain connected to the network; in short, users can remain connected to the network even if data are transmitted, not only by sending data from one side of the user, but also by starting operations from the network at any time; rather than having to establish a connection like a normal dial-up, it is a two-way mode of data transmission.
(2) High-speed transmission
The GPRS uses group exchange techniques to maximize data transmission at a rate of 171.2 kbit/s, which already fully meets the task of data transmission and even of photo transmission, but the theoretical value of 171.2 kbit/s is achieved by using CS-4 coded methods and with a good wireless environment and sufficient confidence. The GPRS used in reality is usually influenced by a variety of factors, such as network coding methods, terminal differences, and the network environment. Currently, the GPRS users have access below 40 kbit/s, which can be increased to around 60 kbit/s ~80 kbit/s with the data acceleration system. The GSM central server provides a cache for each user, approximately 15-25, and will no longer accept new SMS when the cache is fully stored.
(3) Reasonable charges
The GSM SMS method is based on a bar number, and a short message is fixed at a rate that does not exceed the maximum of a single text message; if real-time monitoring is achieved, then the constant transmission of incoming information is required, which is clearly not suitable for the monitoring system. The user, whether or not the data are transmitted, will occupy the wireless channel throughout the connection period. For group exchange mode GPRS, users use channel resources only when transmitting data, that is to say, multiple users can share a wireless channel at the same time, increasing the utilization of resources. And their rates are based on data volume, which avoids unnecessary expenses; when there is no monitoring task, there is no cost even if the connection is not disconnected.
(4) Supports the IP and X.25 agreements.
The GPRS model supports the IP and X.25 protocols now common to the network, which make it more possible to connect objects, and the GSM model can only be used between mobile communications, while the IP protocol ' s inclusion allows for PC-detection module communication and thus for mobile phone monitoring data collection.
- 3.2 Options for the GPRS network
Although the GPRS model chooses to use IP protocols, since most users now use wireless networks transmitted by routers, this mode of IP is mostly an automatic distribution Intranet.
(1 Public network fixed IP method
This way the host has direct access to the public network, i.e., to the Internet, where the user has a fixed IP address. Since the IP address of the terminal is the Internet IP of the GPRS, it can then be communicated between the host and the terminal via the NAT (Network Address Transport) server of the GPRS network.
(2 Public network dynamic IP
The host is connected to the public network, but the IP address is dynamic, using the public network dynamic DNS (domain name resolution server). The monitoring point is connected to the DNS server and the DNS server finds the host dynamic IP connection.
(3 GPRS line mode, mainframe using the GPRS line access network.
(4 GPRS dynamic IP
(5 Binding IP address method
Given the ease of the GPS wireless access dynamic IP approach and the relative reasonableness of construction and communication costs, it is recommended to choose this mode of communication. The monitoring of the network is mostly a server that detects multiple terminals, so that the logical method is a terminal wireless access dynamic IP, with a static IP address on the server.
The network’s fixed IP GPRS group structure is shown in figure 4-2, and the testing centre server has never had a static IP address via broadband access to the Internet. This approach is initiated by a remote terminal, requires prior knowledge of the server’s IP address, and offers to establish an object-oriented (TCP) communication mechanism with the database server, so that the host can communicate directly with the terminal.
Original site pictures are temporarily unavailable:
Figure 4-2 Public Internet fixed IP web network structure
- 3.3 Principle of TCP data transmission
In practical applications, users using the GPRS network typically choose TCP or UDP transmission protocols. The UDP mode of transmission does not provide a reliable connection. It simply sends the IP layer of data out, but does not guarantee that it will reach its destination. That is, the UDP mode of connection does not guarantee the accuracy of the transfer; the TCP method is completely different from the way the UDP is connected. TCP provides a reliable byte service that is connected to the connection; TCP will first need to transmit the data to form a message segment and activate the timer after sending the data, pending confirmation of receipt of the data, and at the other end to confirm the data received, reorder the irregular data and discard the duplicate data. TCP provides end-to-end traffic control and calculates and validates a mandatory end-to-end test.
The TCP completes the connection with three sections, also known as three handshakes. The termination of a connection requires four handshakes. In addition, data dispatch requires confirmation by the result recipient and overtime overtime. As a result, TCP provides reliable communications security in transmissions, although this has slightly increased network costs and increased communications costs.
- 3.3 GPRS/Particle Sampler Terminal Communication Protocol
A complete response system is required for the communication of the GPRS module with the Monitoring Centre, with the following main functions:
(1 On-board, automatic dial-up can be achieved, and data communication with the GPRS centre can be achieved as long as the IP address of the centre is valid and within the reach of the communication signal.
(2 Transmit SIM card number and test data via the GPRS back to the testing centre, where the terminal SIM card number is the only one that can be distinguished by the card number.
(3 Auto-connected after disconnection to ensure permanent online status.
(4 The terminal has an autonomous return of data, a call from the monitoring centre, and a stop of the return mode. The automatic time-remittance data is set up. When the test centre sends back the command, the terminal enters the call mode of the centre, where a command is sent before the data message is returned.
(5. A fixed time return is used in the autonomous return mode, and a fixed return time can be set up at the testing centre.
(6 Terminals can set back IP and remote control of terminal restart.
(7 The terminal requires data caches, automatic preservation of a fixed return track when the GPRS is offline or blocked, and automatic re-issuance when the communication is restored, so that there is no GPRS jamming causing the data to be interrupted.
The main communication protocols are as follows:
(1) Set up the connection login package
After terminal start-up, there is also a set communication port number, connected and sent login package, with a binary data sent in the protocol, and all data, including return time interval, traffic of two bytes, are in Little Endian format, i.e. low bytes stored in the memory, judged first, or directly in the absence of 0x1a; Replace it with an unincorporated character and add 0x1a to the end of the package, indicating that it replaces 0x1a. The commands in the data in the package change accordingly and add 0x20 to the original basis. Login package format, terminal-> testing centre: as shown in table 4-1.
Table 4-1 Login package format
Use the data packet length as a header
command words
Terminal id (card number)
Whether to have autonomous backhaul mode
Autonomous return time interval
Heartbeat packet sending interval
Checksum
9 (pack length, not including oneself, 1 byte)
0x11 (1 byte)
(2 bytes)
(1 byte, 0 is not, 1 is)
(2 bytes)
(2 bytes)
All previous values, including head (1 byte)
For example: 09^1a^01^08^07^58^02=46, terminal No. 1 will be returned on its own 30 minutes, with a 10-minute interval between the transmission of a heartbeat package and a login check-in check-up of 0x46 sent.
(2) Login package confirmation
The centre receives a log-in request from the terminal, records the ID and returns the log-in confirmation package to the terminal, which then enters the normal working mode, the centre-> terminal. The log-in package is formatted as table 4-2.
Table 4-2 Login package determination
Packet length
command words
Terminal ID (card number)
Checksum
4 (packet length, 1 byte)
0x21 (1 byte command)
(2 bytes)
All information in the front is of different or different value, including the header (1 byte)
(3) Send traffic data (without distinction between auto-remittances or callbacks, 5-minute default autoreturn interval), information package format, terminal-> testing centres. The format is shown in Table 4-3.
Table 4-3 Send data traffic
Packet length
command words
Terminal ID (card number)
Datagram
Checksum
Packet length, 1 byte
0x1b (1 byte)
(2 bytes)
(time [8bit], sampler flow speed [8bit], temperature [8bit]) 3 bytes
XOR all values, including header (1 byte)
(4) Call back order, test centre call terminal, immediately return data, detection centre-> terminal, call call back order format as shown in Table 4-4.
Table 4-4 Call back command
Packet length
command words
Terminal ID (card number)
Checksum
4 (Packet Length)
0x2b (1 byte command)
2 bytes
All information in the front is of different or different value, including the header (1 byte)
The corresponding terminal receives the call order and sends the data to the detection centre in the same format as the order 0x1b.
(5) The centre sets up an automatic return time interval command, the centre-> terminal, and the centre sets the automatic return time, as shown in tables 4-5.
Table 4-5 Center set automatic return time
Packet length
command words
Terminal ID (card number)
Time Interval
Checksum
6 (1 byte)
0x2d (1 byte)
(2 bytes)
Set return interval (2 bytes)
XOR of all previous information values (1 byte)
When the information is received, the terminal sets a callback time and answers the confirmation order to the monitoring centre, the terminal-> monitoring centre and the return order as shown in Table 4-6.
Table 4-6 Center set automatic return time
Packet length
command words
Terminal ID (card number)
Time Interval
Checksum
6 (1 byte)
0x1d (1 byte)
(2 bytes)
Current postback interval (2 bytes)
XOR of all previous information values (1 byte)
(6 The Monitoring Centre sends a restart order to the terminal, and the Monitoring Centre-> Terminal, as shown in tables 4-7.
Table 4-7 Restart command
Packet length
command words
Terminal ID (card number)
Checksum
4 (Packet Length)
0x2f (1 byte command)
2 bytes
All information in the front is of different or different value, including the header (1 byte)
After receiving a restart order, the confirmation package is first sent and then the terminal-> monitoring centre is restarted at the appropriate time, as shown in tables 4-8.
Table 4-8 Confirm restart command
Packet length
command words
Terminal ID (card number)
Checksum
4 (Packet Length)
0x1f (1 byte command)
(2 bytes)
All information in the front is of different or different value, including the header (1 byte)
(7 The Monitoring Centre sets the IP and port instructions to the terminal, which are provided by the Monitoring Centre-> Terminal, as shown in tables 4-9.
Table 4-9 Set IP and port
Packet length
command words
Terminal ID (card number)
New IP
New port
Checksum
10 (1 byte)
0x20 (1 byte)
(2 bytes)
New IP (4 bytes)
Port number (2 bytes)
XOR of all previous information values (1 byte)
After receiving the command, the terminal sends a confirmation package to the testing centre, then closes the current connection within 30s and attempts to connect with a new ip address and port number, or reconnects the old connection if the connection is not successful. The confirmation package is shown in tables 4-10.
Table 4-10 Confirm the setting of IP and port
Packet length
command words
Terminal ID (card number)
New IP
New port
Checksum
10 (1 byte)
0x10 (1 byte)
(2 bytes)
Set IP (4 bytes)
Set port number (2 bytes)
XOR of all previous information values (1 byte)
The data will be tested for 0x1a before sending data, if not directly sent; if 0x1a is available, replace the character not contained in the package with the character added at the end of the sentence, indicating that the character has been replaced by 0x1a. The command word of the package has been changed accordingly, adding 0x20 to the original base. If the terminal returns contain 0x1a, the format is shown in tables 4-11 below.
Table 4-11 Send 0x1a
Packet length
command words
Terminal ID
Datagram
Replaces the byte of 0x1a
Checksum
9 (1 byte)
0x3b (1 byte)
(2 bytes)
(time [8bit], sampler flow speed [8bit], temperature [8bit]) 3 bytes
(1 byte)
XOR all values, including header (1 byte)
The centre sends IP and port reconnection commands (0x20) in the format shown in tables 4-12.
Table 4-12 Send IP port commands with 0x1a
Packet length
command words
Terminal ID
New IP
New port
Replaces the byte of 0x1a
Checksum
11 (1 byte)
0x40 (1 byte)
(2 bytes)
New IP (4 bytes)
Port number (2 bytes)
(1 byte)
XOR of all previous information values (1 byte)
- Monitoring Center
The monitoring centre can use the PC machine as a terminal to receive and display data information. But the choice of the network must be based on a computer with a public network IP. The GPRS module does not need to be added.
- 1 VB software design
- 1.1 Use of WinSocket controls in TCP applications
In the TCP application, its data transfer protocol allows for the creation and maintenance of remote computer connections. First, we need to know the server computer name/IP address and the communication port. First, we have to match the Remote Host and Remote Port properties on the Winsock control to the server end and then connect with the Connect method; When there is a connection request, the server will create a ConnectRequest event and call the Accept method. The sender will send it using SendData, the receiver will call the DataArrival event and get the data using GetData, and a simple connection will be established.
The largest difference between TCP and UDP is that TCP is a link-oriented agreement, which must be connected before data are sent and sent, and must be maintained at the time of dispatch.
The steps of the sender are as follows (the initialization, closure, etc. of the Socket environment is omitted):
(1). Create a sock with a sockt function;
(2) To bind socket to a local address with bind;
(3) Listen interrogate socket sets;
(4). Receive the customer's connection with the accept function and return the client's formula packagecientSocket;
(5). Sending data using send on client package;
(6). Close the patches sock and clearSocket with the Closesocket function;
The steps for the data receiver are as follows:
(1). Create a sock with a sockt function;
(2) Creating a remote address to the service provider;
(3). Connecting socks to service providers using remote addresses;
(4). The use of recv for receivers;
(5). Close the sock with the Closocket function;
- 1.2 Establish connection
The connection could be made once both the client and the server had been established, starting with a server-end program control, which was listening to the client ' s client; When the client uses the Connect method, the Clit controls are connected to the server, then the server waits for the connection request, the Lister controls trigger the ConnectReQuest event, the dynamic distribution is not used for the Server controls, and the current connection is moved, so the client request is received, while the server window is shown and given value and connected.
- 1.3 Data transmission
Data transfer is possible when the connection is established. The client executes Clint's SendData method by sending the corresponding data, while the server triggers the DataArrival event for the Server control and implements the GetData method to receive the client data, so that the data can be seen on the interface. At the same time, the server executes the SendData method by returning the data to the client, and the client Clinent Control triggers the DataArrival event to receive the data from the server so that the data transfer process can be completed.
- 2 Database design
The database is designed primarily for the data received and sent, on the one hand, with an interface showing the measured particle concentration data and, on the other hand, with a cumulative collection of data to enable the detector to carry out data and historical queries. These operations can greatly simplify the operations of the detector; and, at the same time, the Centre is required to monitor multiple data acquisition points, requiring distinctions such as the GPS module SIM card number, equipment number, air particle concentration data, time, etc.; These need to be in the database so that they can be distinguished and searched. The data content is shown in tables 5-2.
Table 5-1 Database content
Field name
Data type
Field description
ID
Numbers
The sending end GPRS module SIM card number
TIME
Date/time
Collection time
Temperature
Numbers
Temperature data
- 3 Interface Design
The interface design is based on two main points. The first is the presentation of the data transmitted on the interface. The second is the processing of data, including storage, querying, and so forth. The presentation of data is based on the Chart control, which was originally used for the production of simple statistical maps using Excel's kernel. However, it is required to bind data controls and bind data from SQL or Access. The data transmitted are then stored in the database and then removed from the display of the user controls. The database uses the Access database, which also requires the display of the data interface, with the addition of the ListView control, which enables the table to be displayed, and the addition of the data query, which allows the historical data to be searched.
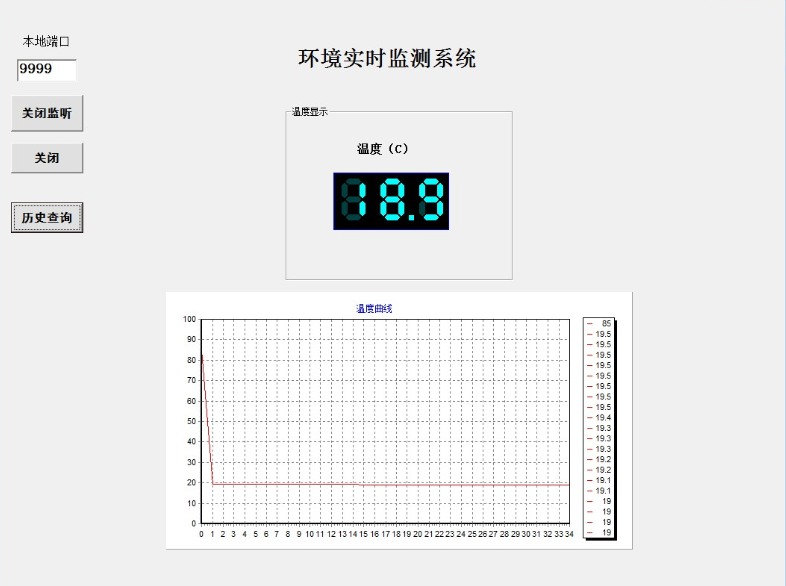
Figure 5-1 Monitoring interface
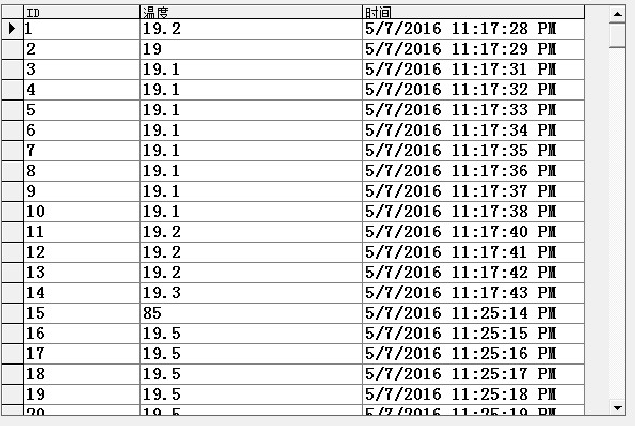
Figure 5-2 Database interface
- Conclusion
After more than two months of design and commissioning, GPS remote control monitoring and data transmission have been achieved initially. It has also encountered a number of difficulties and areas of knowledge that it has not been able to access, which have eventually been resolved, with the major problems of communication and debugging. As early as the initial design, the GSM mode of communication was considered, and the limitations of GSM communications were recognized under the guidance of the business mentors, taking into account the high cost of 3G and 4G communications, and ultimately the selection of very mature GPS communications that could meet the project transmission requirements, with the calibration of the hardware map as shown in figure 6-1:
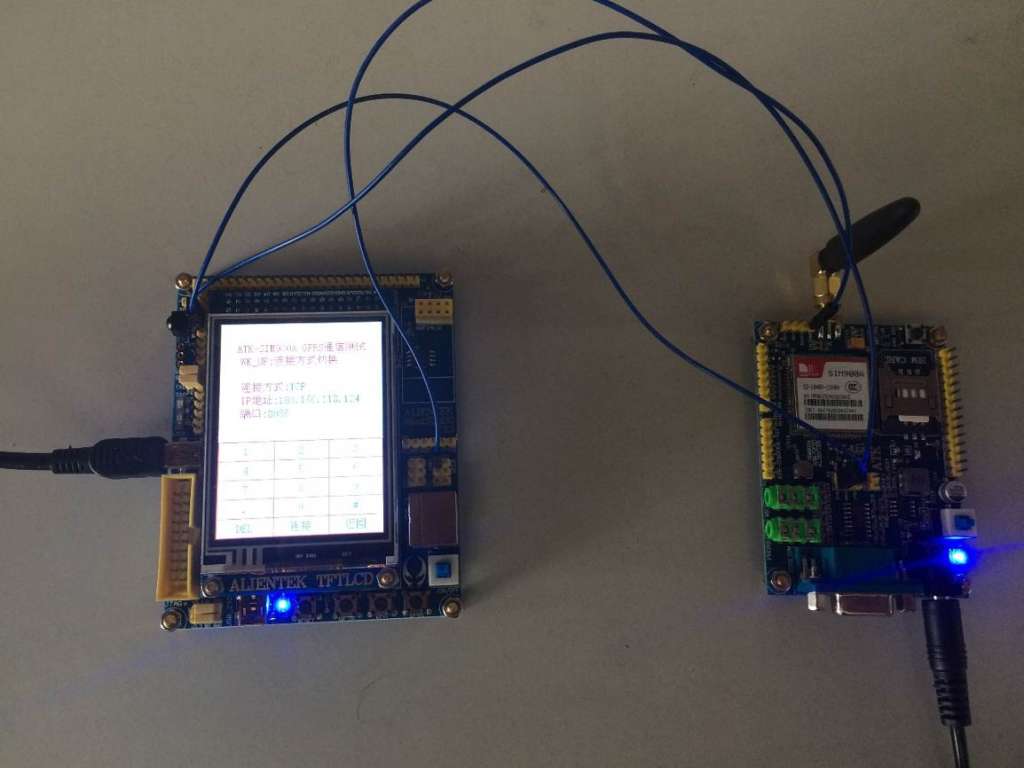
Figure 6-1 Hardware debugging diagram
The initial phase of the project, which took into account the long life of the project and did not plan to include hardware design, plans to use the existing circuit boards of the project. The debugging exercise revealed that the original circuit and interface design was not reasonable, and ultimately completed the drawing and boarding of the circuit map on its own under Mr. Wang’s technical guidance. The system debugging encountered minor problems, which resulted in the project being delayed by approximately two weeks owing to the inability of the unit to access the public network IP, and the final access to the information setting router was successful in the laboratory, while difficulties were encountered in the production of the communication protocol, which was not understandable for the transmission of the information and for the automatic response, and ultimately was resolved by a thorough review of the TCP communication protocol with technical guidance.
The final design of the system includes both the testing centre and the data collection station. The testing centre is able to successfully receive data from the site and keep them in the database, while data can be searched and air particulates can be monitored in real time, largely completing the remote data collection mission.
Acknowledgments
It took me more than four months to develop this design. At the time of its completion, I wanted to thank my mentor, Professor Wang Man, for his patient guidance in writing, as well as for his professional and rigorous scientific experience, which enabled me to learn solid expertise. I was particularly impressed by his dedication and real-time commitment. Here, I would like to express my sincere gratitude to Mr. Wang.
It is also to thank Professor Wu Weihua, the business mentor, who has been working at the Shanghai Instrumentary Institute since July of last year under the guidance of Mr. Wu; I have come from a team of companies, social incomprehensible little whites, to the beginning of my career. He has learned not only from the rigorous, real-time and persistent scientific spirit of being a researcher, but also from social experience and interpersonal interaction. This is the first and most painful step I have taken from the school, and I am deeply honoured to be under the care of Mr. Wu, to whom I once again express my deep appreciation.
While thanking the mentors, it is important not to forget that it is the professional teachers who have worked tirelessly in teaching, teaching, and teaching that has enabled us to learn solid expertise, perhaps these intellectual theories, but who will play an indispensable role in our future career. I also thank my fellow students, Zhou Kai, for their comments and suggestions on the revision of the paper, and for taking valuable time to review my paper. And thanks to my parent school, Shanghai Second Industrial University, I learned to live in a better teaching environment, and I was able to study and discuss it in a laboratory. My life was the first step in life, and I was confident that it would be a wonderful part of my life.
References
[1] Marriotpo. Research on remote weighing data acquisition methods based on RS232-RS422/485 communications interface. Ankang College Journal, 2006, 18(04): 81-87;
[2] Wang Chi Wei. GPRS remote data acquisition method based on Socket. Sian University Journal: Natural Sciences, 2006, 25 (1): 37-39;
[3] Research on remote data collection based on the Internet Production Line Control System. Hebei Industrial University, 2005
[4] Donna. Analysis of the design of remote data acquisition and control systems based on wireless mobile communication networks and Internet networks, science and technology research, 2014
[5] Trina. Design of the embedded GPS network remote data acquisition control system based on STM32. Coal technology, 2015,32 (8):198-198
[6] Contest. Remote wireless data acquisition system based on GSM and ZigBee. Communication technology, 2011,44 (8):71-73
[7] Young Su-in. Research and Design of a Remote Wireless Data Acquisition System based on GSM SMS, Chongqing College of Engineering Journal: Natural Sciences Society, 2007, 21 (11): 103-105
[8] Chen Jin. Remote data acquisition system development based on Labview, instrumentation techniques and sensors, 2006(6): 27-28
[9] Guo Xuan. Remote data acquisition control distribution system design. Microcomputer information 2006, 22 (16): 137-138
[10] Pamvenyau. Research and development of remote control systems based on C/S models. Zhejiang University
[11] Raul Ionel;Gabriel Vasi;Septimiu Mischie.GPRS based data acquisition and analysis system with mobile phone control.Measurement,2012,45(6)
[12] Pietari Pulkkinen ;Mikko Laurikkala; Quality management in GPRS networks with fuzzy case-based reasoning.Knowledge-based systems,2008, 21(5)
[13]Walke,B.H. The roots of GPRS: the first system for mobile packet-based global internet access.IEEE wireless communications,2013, 20(5)
Appendix A Graduation project company site
Company Profile:
The Shanghai Instrumentation Institute (SIF) was established in 1993, and the county is affiliated with the Shanghai Academy of Sciences, one of the leading research institutes of Shanghai City. The Institute is a member of the Board of Directors of the China Society for Instrumentation and the Deputy Council of the China Institute for Electric Measurement, a deputy chairman of the Shanghai Institute for Instrumentation, a secretary-general ' s unit and a member of the Shanghai City Institute for Instrumentation, a member of the Board of Directors of the China Association for Instrumentation Industries and the Vice-chairperson of the Electrician Survey, etc., and a member of the Board of Directors of the Third Branch of the National Committee for Electricized Instrumentation.
Introduction to corporate mentors:
Wu Weihua, a man and a senior engineer, graduated from undergraduate studies in detection techniques and instruments at Shanghai University of Transport in 1993 and a master of engineering. He is currently the Deputy Chief Engineer and Director of the Research and Development Centre of the Shanghai Instrument Research Institute and Deputy Director of the Shanghai Electrician Instrument and Monitoring and Control System Technical Services Platform. He is a member of the Third Branch of the China Electrician Instrumenting Committee.
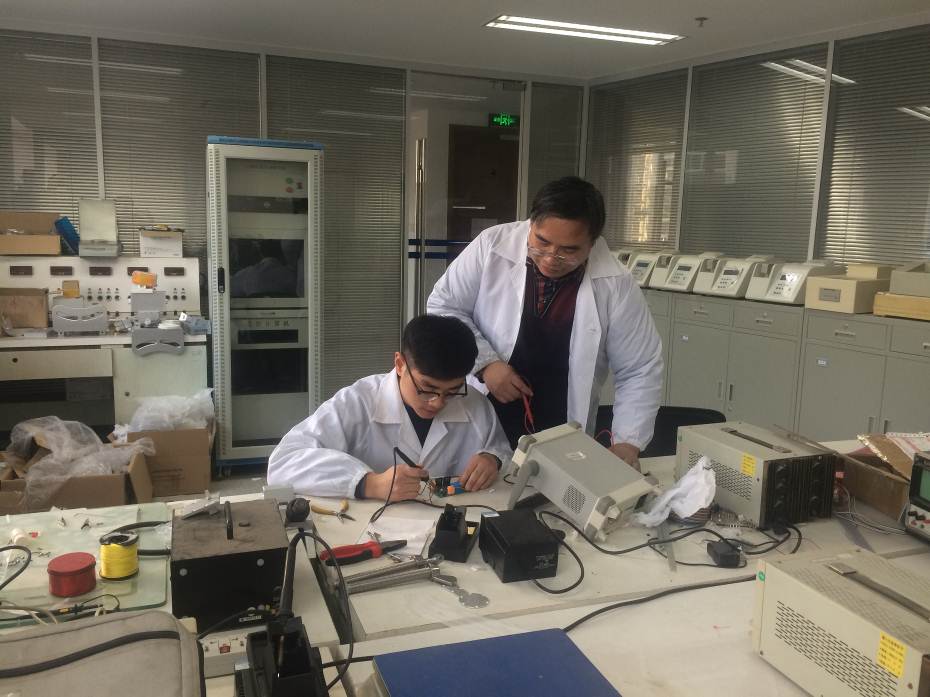
The work is done on the left side by the student Wang Si, and on the right side by Wu Weehua’s mentor.
Appendix B CD information description
Directory structure:
There are three folders on CD-ROM, one for thesis, the student manual and the other for the subject.
The files included are:
1. Paper
- Dissertation - 12 graphs C1 - 20124832201 Wang Qianjin.
2. Student manual
- Student ' s manual - -12 C1 - - 20124832201
3. Project
- Project programming document for long-range data acquisition and control software for air particle samplers.
- GPRS module and STM 32 module circuits and PCB drawings in the design of the Air Particle Sampler Remote Data Acquisition and Control Software.
Appendix C
GPRS/Particle Sampler Terminal Communication Protocol Reference Table, as shown in Annex C-1.
Annexed to the Table is the C-1 GRPS/Particle Sampler Terminal Communication Protocol Reference Table
command words
Contents
Data flow direction
Remarks
0x11
Login package
Terminal->Center
Login package is sent after the terminal is started
0x21
Login package determination
Center->Terminal
The terminal receives a log-in request, records log-in id and returns the terminal.
0x1b
Send packet
Terminal->Center
Send detection data to the detection center
0x2b
Call command
Center->Terminal
The centre calls the terminal at its own initiative and requests that the data be transferred to the centre
0x2d
Set the automatic return time
Center->Terminal
Center sets automatic return time
0x1d
Terminal reply sets the automatic return time
Terminal->Center
Terminals send autoback time settings to testing centres
0x2f
Automatic Restart
Center->Terminal
Testing center sends automatic restart command
0x1f
Automatic restart after reply
Terminal->Terminal
Automatic restart after reply
0x20
Set reconnection
Center->Terminal
Center sends IP addresses and port commands to terminal
0x10
Reconnection reply
Terminal->Center
Terminal receives IP and port settings, sends a reconnection response and reconnects, or links old connections if they cannot be connected